Remove data-visuals
article thumbnail

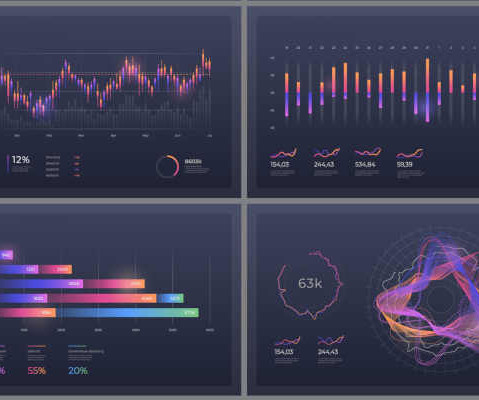
Are Your Data Visualizations Readable by Everyone?

SCMR (Supply Chain Management Review)

Don’t wait until someone asks, and don’t force someone to be an exception: make sure that your data visualizations can be read by all those who receive them. Good reporting standards should be part of an organization’s policies and guidelines.

Data 99
article thumbnail

Spend Analysis Dashboards: Visualizing Your Procurement Data

Empowering CPO

At its core, spend analysis is a strategic process designed to consolidate, cleanse, classify, and analyze expenditure data with the purpose of increasing procurement efficiency, improving cost-effectiveness, controlling spend, and monitoring compliance. The Power of Data in Procurement A.

Data 52
professionals

Sign Up for our Newsletter

This site is protected by reCAPTCHA and the Google Privacy Policy and Terms of Service apply.

article thumbnail

Jump Technologies Introduces New Data Visualization Capabilities for Hospitals

Supply Chain Brain

Jump Technologies, a hospital supply chain solutions provider, announced today the expansion of its JumpStock capabilities to include data analytics and supply chain visualizations.

Data 74
article thumbnail

AI and Digital Twins Revolutionize 2024 Warehouse Operations

Supply Chain Brain

Warehouse management systems have long produced a wealth of data relating to picking, packing, slotting and inventory management, but the visualization capabilities provided by digital twins go a long way toward making that information actionable.

article thumbnail

ivoflow: Vendor Analysis —  Direct spend management solution overview, roadmap, competitors, user considerations, analyst summary

Spend Matters

To address such challenges, ivoflow has built an intuitive solution that combines internal procurement data and external market intelligence to identify opportunities automatically. ivoflow’s value proposition extends beyond data visualization, which is what traditional BI tools offer.

article thumbnail

Examples and uses of GIS

IBM Supply Chain Blog

One of the largest sources of data is all around us—that is, geospatial data. Geographic information systems (GIS ) visualize and make sense of this data, helping people and businesses better understand the patterns and relationships of our world. Read more about the initiative here.

Data 104
article thumbnail

How to establish lineage transparency for your machine learning initiatives

IBM Supply Chain Blog

The answer lies in the data used to train these models and how that data is derived. In this blog post, we will explore the importance of lineage transparency for machine learning data sets and how it can help establish and ensure, trust and reliability in ML conclusions.

Data 86